Cadence Shifts on the Slopes: Overlaying Onboard Footage with Power Metrics in Pro Cycling Mountain Stages
Written by Yves Simon · Aug 8, 2026
Cadence Shifts on the Slopes: Overlaying Onboard Footage with Power Metrics in Pro Cycling Mountain Stages
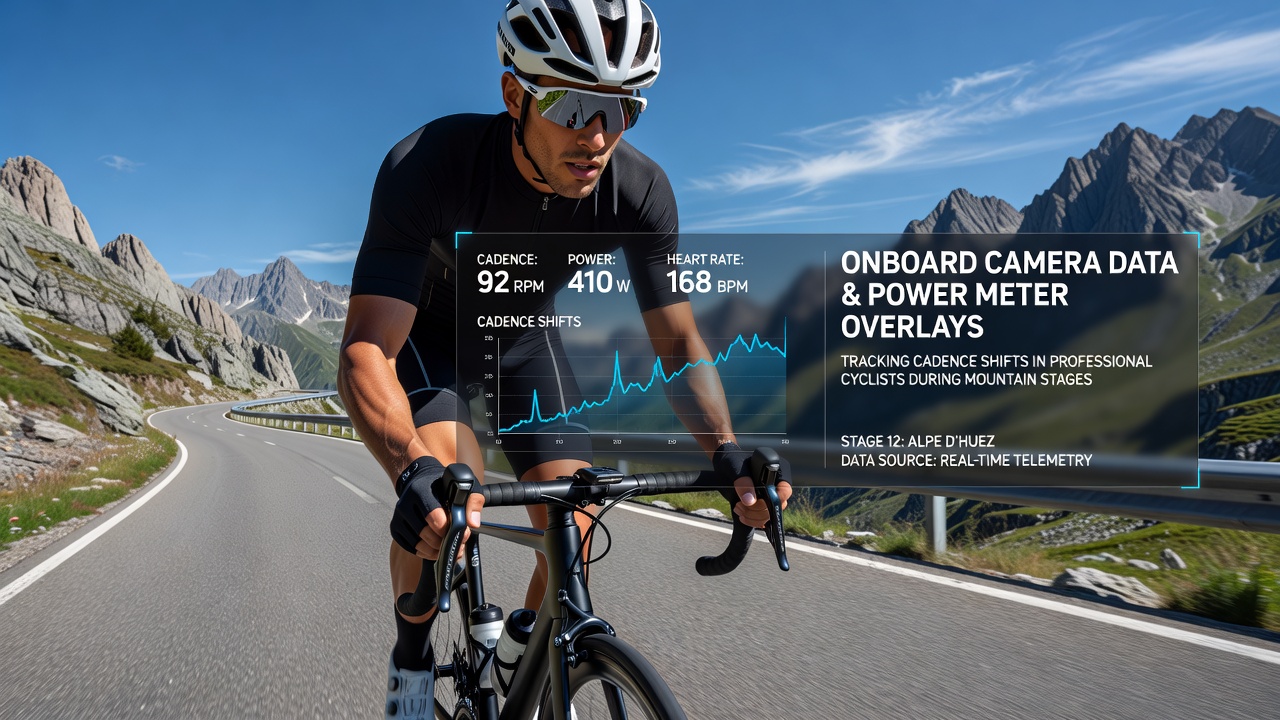
Professional cycling teams have turned to synchronized onboard camera feeds and power meter readings to track how riders adjust their pedal rates during the steepest sections of mountain stages, and this approach gained wider adoption ahead of the 2026 season. Data collected from devices mounted on team support vehicles captures the full motion of the lower body while power meters record instantaneous output in watts, allowing analysts to align visual cues with numerical values at the same timestamps.
Methods of Data Capture and Synchronization
Teams equip bikes with dual recording systems that log cadence every second alongside torque and speed, then merge those streams with video from forward-facing and side-angle cameras. Synchronization occurs through shared time codes so that a drop in revolutions per minute appears on screen at the exact moment wattage output changes. Observers note that this combination reveals whether a rider maintains a steady 80 to 90 revolutions per minute on gradients above eight percent or shifts to a lower cadence when power spikes above threshold levels.
Software platforms overlay the metrics directly onto the footage, creating split-screen views or transparent numeric readouts that scroll in real time. Analysts at training centers review these files after each stage, tagging moments where cadence falls below established baselines for that rider. The process takes place daily during Grand Tours, with particular attention paid to the final climbs where accumulated fatigue influences pacing decisions.
Observed Patterns Across Recent Mountain Stages
Footage from the 2025 Vuelta a España showed several general classification contenders dropping from 85 revolutions per minute to 72 on ramps steeper than ten percent while sustaining similar wattage figures, a shift that coincided with visible changes in hip angle and saddle pressure. Researchers tracking these sequences found that riders who held cadence above 78 revolutions per minute for longer intervals on successive climbs posted smaller time losses in the overall standings. The same patterns emerged in shorter mountain stages during the Critérium du Dauphiné, where data sets from multiple teams confirmed that early cadence reductions often preceded larger power drops later in the stage.
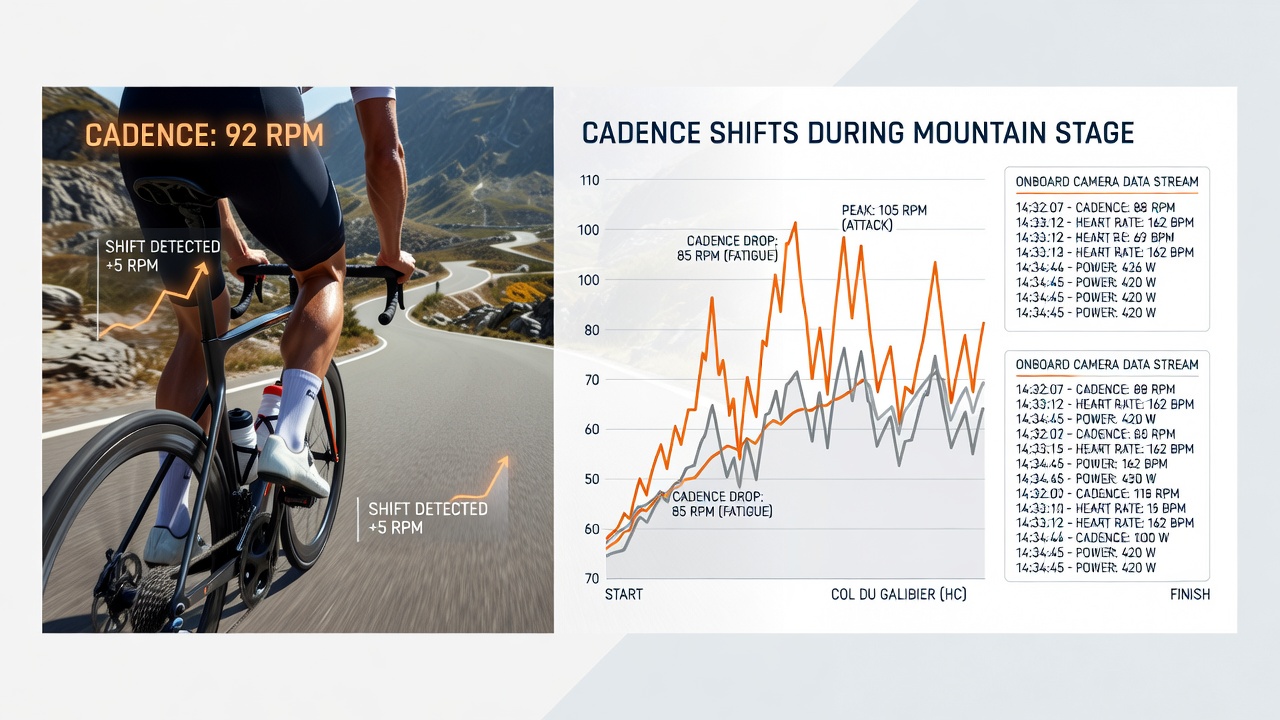
Those reviewing the archives point out that certain riders maintain higher cadence through seated climbing while others stand and push lower rates, yet both approaches can produce comparable power curves when matched to the terrain profile. The overlay technique makes these individual signatures visible without requiring on-site observers, and it supports post-stage debriefs that compare a rider's actual output against pre-stage targets set by coaches.
Integration with Training and Equipment Adjustments
Coaches use the combined video and power records to adjust gearing choices and cadence drills in the weeks before major August races such as the Vuelta a España. Riders practice maintaining target ranges on indoor trainers while watching their own stage footage, which helps translate the data into physical adjustments. Equipment suppliers have responded by refining crank length options and pedal sensor accuracy so that smaller cadence variations register more clearly on the overlays.
Studies conducted at the Australian Institute of Sport examined how these analytical methods influence recovery protocols between stages, noting that riders who display early cadence fatigue receive modified training loads the following day. The same records feed into aerodynamic assessments because body position changes visible on camera often accompany the cadence shifts recorded by the power meters.
Broader Applications in Performance Analysis
Beyond individual rider reviews, aggregated data sets from multiple teams allow comparisons across different mountain profiles and weather conditions. Analysts at research institutions compile these archives to identify thresholds where cadence typically declines, then test interventions such as altered hydration strategies or pacing plans. The approach has spread to development squads preparing for under-23 events, where younger riders learn to interpret their own overlays before entering professional ranks.
Industry reports from organizations tracking sports technology adoption show steady growth in the number of WorldTour teams using integrated camera and power systems, driven by the availability of lighter recording hardware that fits within UCI weight regulations. The resulting libraries of footage now serve as reference material for biomechanists studying how pedal stroke efficiency changes under prolonged load.
Conclusion
Tracking cadence shifts through onboard camera data and power meter overlays supplies teams with precise, timestamped records of rider behavior on mountain stages that static numbers alone cannot convey. As the 2026 season approaches, continued refinement of these tools supports more targeted training adjustments and equipment decisions across professional cycling. The method continues to evolve with improvements in sensor precision and video resolution, expanding the detail available for performance evaluation.