Javelin Throw Velocity Curves: Frame Analysis from Olympic Archives Reveals Release Mechanics
Written by Yves Simon · Jul 23, 2026
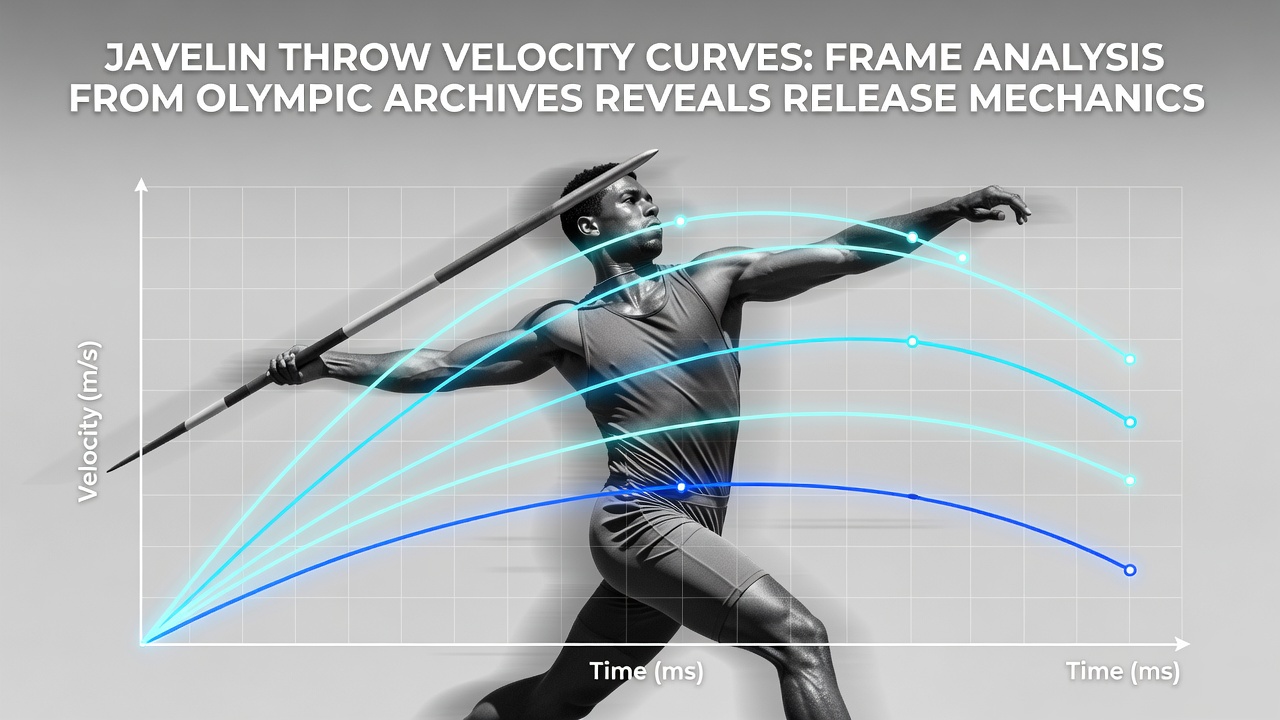
Javelin Throw Velocity Curves: Frame Analysis from Olympic Archives Reveals Release Mechanics
Analysts have examined extensive Olympic video archives to map velocity curves throughout elite javelin performances, and the data highlights consistent patterns in how throwers build speed before the critical release moment. Researchers at institutions across Europe and North America have processed high-speed footage from multiple Games cycles to quantify acceleration phases, with particular attention to the final three steps where peak velocities often emerge. Studies from the Australian Institute of Sport and similar bodies in Canada demonstrate that release speeds typically range between 28 and 32 meters per second among medalists, yet the shape of each curve varies based on individual run-up rhythms and plant timing.
Run-Up Acceleration Patterns
Throwers generate initial momentum during the approach, and frame sequences reveal gradual velocity increases that accelerate sharply in the final meters. Data from London 2012 and Rio 2016 shows athletes reaching 6 to 8 meters per second by the end of the run-up, with smooth transitions that prevent energy loss at the crossover steps. Observers note how elite performers maintain forward lean angles between 15 and 20 degrees, allowing kinetic energy to flow directly into the throwing arm without disruption.
Transition and Plant Phase Dynamics
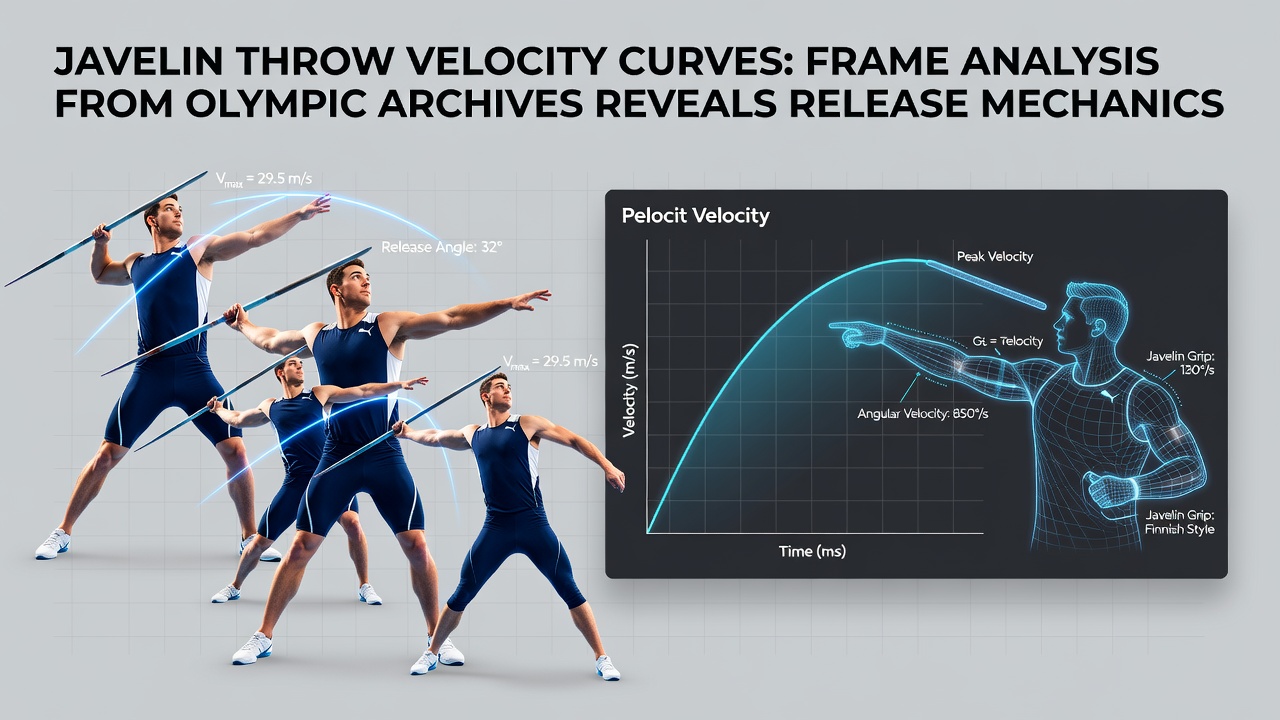
The plant foot strikes the ground at a precise angle that converts horizontal speed into rotational force, and archival breakdowns illustrate this shift through overlaid velocity graphs. In Beijing 2008 footage, several finalists exhibited a 0.15-second window between plant and hip rotation where curve slopes steepened dramatically. Those who've reviewed the sequences point out that delayed plant timing flattens the velocity curve, reducing overall release power by measurable margins according to motion-capture comparisons conducted at university labs in Germany and the United States.
Release mechanics receive the most scrutiny because small deviations produce large differences in distance. Frame analysis from Tokyo 2020 indicates that optimal release occurs when the throwing shoulder reaches maximum extension while the elbow maintains a 140-degree angle, creating a final velocity spike visible on every curve. Athletes who time this sequence correctly achieve the characteristic sharp upward inflection that separates record throws from average ones.
Comparative Data Across Olympic Cycles
Archives spanning four decades allow direct comparison of velocity curves between eras, and researchers have identified incremental improvements in peak release speeds alongside more consistent curve shapes among top competitors. Figures from the 1980s show greater variability in acceleration rates, whereas modern athletes display tighter groupings around optimal profiles. A 2024 report compiled by the International Olympic Committee’s technical studies group noted that average release velocities have risen approximately 1.2 meters per second since 2000, correlating with refined training protocols tracked across multiple national federations.
Application in Athlete Development
Coaches now integrate these archived curves into training software that overlays current throws against historical benchmarks, and several national programs have adopted the method ahead of the 2026 World Athletics Championships scheduled for July in Tokyo. The approach lets athletes visualize exactly where their velocity curve deviates from elite models during the critical plant-to-release window. Evidence from controlled trials conducted at Loughborough University shows measurable gains in release consistency after six weeks of targeted curve-based feedback sessions.
Conclusion
Olympic frame analysis continues to supply precise velocity data that clarifies how release mechanics determine performance outcomes. By examining curve shapes across past Games, researchers and coaches obtain objective references that guide technical adjustments without relying on subjective impressions. Continued archiving of high-speed footage ensures future generations can track incremental refinements in javelin throwing efficiency.